Hear it
before it happens
Every metric on your cluster is a vital sign. Whaleal Platform tracks them continuously, and the moment
one crosses the safe line, the signal reaches the right person immediately — instead of waiting for the
business team to come knocking.
Live vital signs, refreshed continuously — the alert is already on its way the instant the line is crossed
Monitoring isn’t the problem. Monitoring nobody responds to is.
Most teams stop at “we have a dashboard” — the charts look great, but nobody’s actually watching them.
Alerts get configured once and then either fire too often, training everyone to mute the channel, or fire
too late, arriving well after the incident has already unfolded.
A threshold gets set once and never revisited — the business triples in scale, and the alert line is still
where it started
A 3 a.m. alert says nothing more than “CPU is high,” with zero context, leaving the on-call engineer to
dig from scratch
Too many alerts, too much noise — the team quietly muted the notification channel a long time ago
See everything, so you can see accurately
WAP collects metrics from both the host and the MongoDB instance layer — from basic CPU, memory, and disk
I/O, to connection counts, replication lag, lock waits, and slow-query share — every metric recorded
second by second, never sampled or estimated.
Host-Level Metrics
CPU · Memory · Disk I/O · Network Throughput
Instance-Level Metrics
Connections · Queue Length · Opcounters · Cache Hit Rate
Replication Health
Election Frequency · Oplog Lag · Heartbeat Status
Query-Level Metrics
Slow Query Share · Lock Wait Time · Scan Efficiency
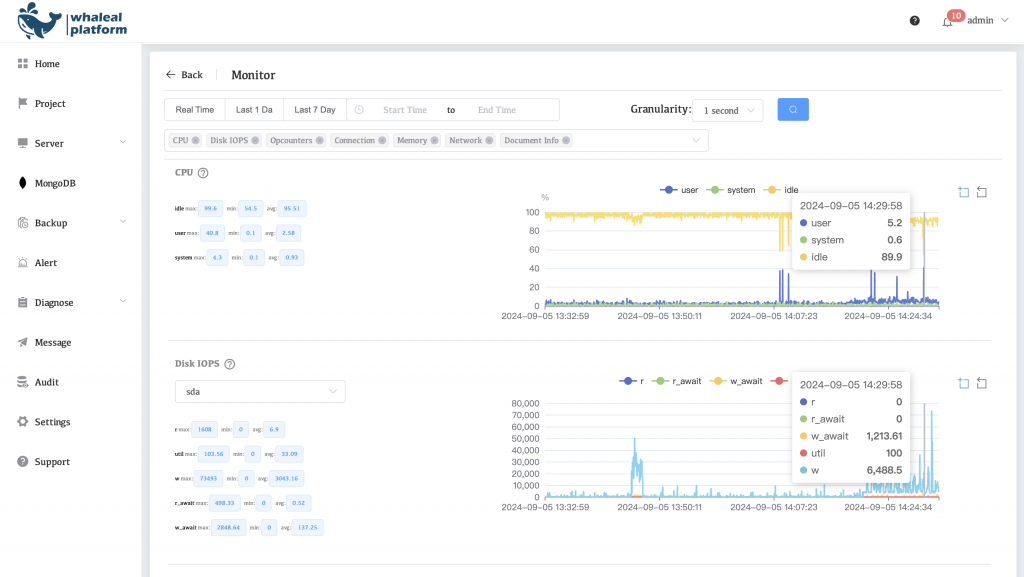
Detailed Monitoring Metrics
Every metric visualized — anomalies visible at a glance.
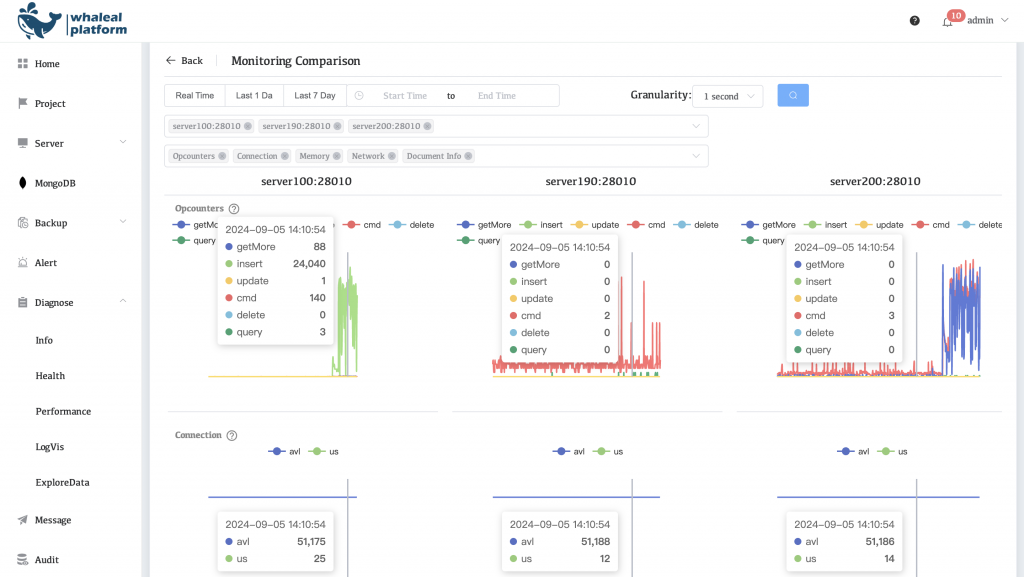
Multi-dimensional Comparison
Cross-node, cross-cluster comparisons side by side.
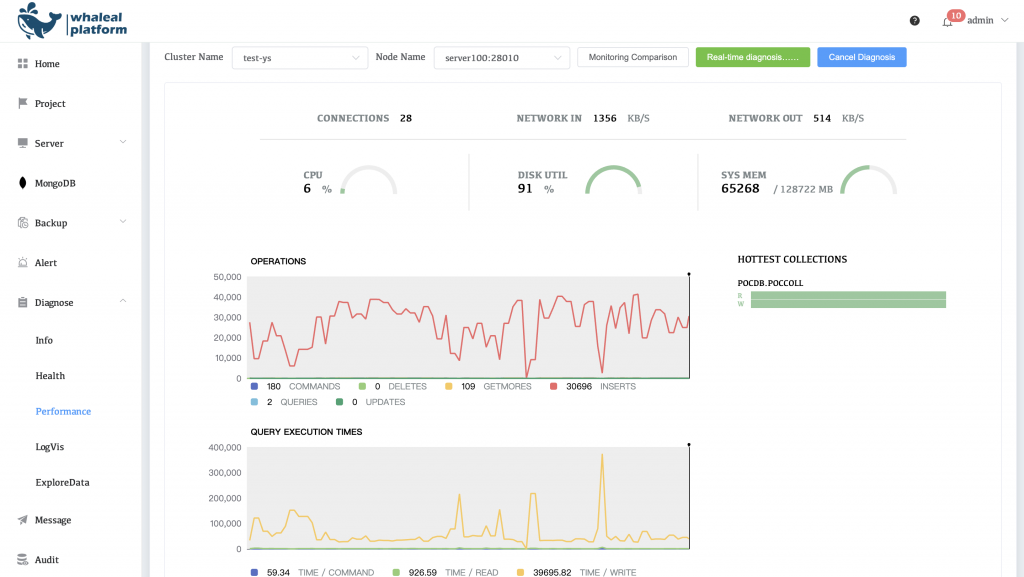
Real-Time Performance Diagnostics
Health status refreshed live, risk flagged before it escalates.
Alerting isn’t “sending a notification”
A genuinely useful alerting system isn’t really about the trigger condition — it’s about tiered response.
The same CPU spike happening during a quiet Tuesday afternoon and during peak traffic deserves a
completely different response path.
Threshold Crossed
Live values compared against thresholds
Severity Classified
Info / Warning / Critical
Dedup & Suppress
The same issue won’t spam you twice
Precise Delivery
Routed to the right channel by severity
By the time the alert fires, the reason is already on screen
Most alerting systems only shout “something’s wrong” and leave the investigation to a human. WAP attaches
context automatically — collapsing “spot the problem” and “find the cause” into a single step.
shard02
replication lag hit 128ms, over the 100ms threshold
pressure.
Don’t wait for the business team
to tell you something’s wrong
From reactive response to proactive early warning — that’s exactly why Whaleal Platform’s monitoring and
alerting module exists.