The Best Practice For MongoDB.
Whaleal Platform delivers comprehensive MongoDB monitoring for performance and issue detection.

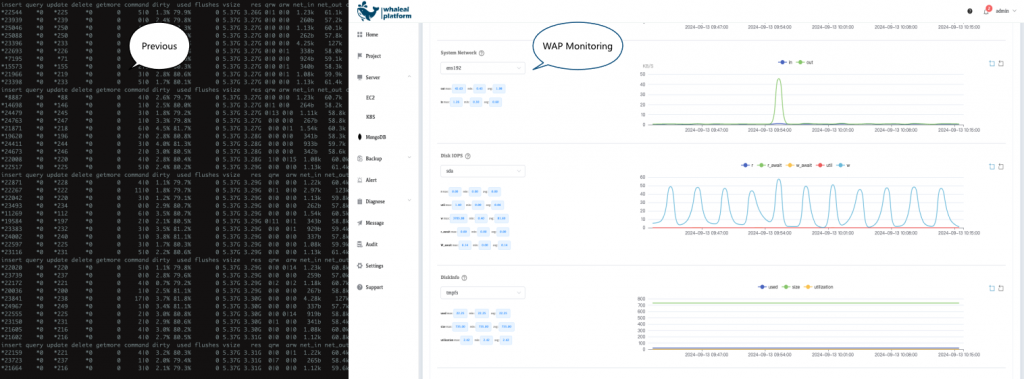
Which kind of monitoring do you prefer?

In database management and maintenance, monitoring is a key aspect of ensuring database performance, stability, and health. MongoDB, as a high-performance, distributed NoSQL database, has high operational complexity, especially in cluster and large-scale deployment scenarios. Therefore, comprehensive and detailed monitoring is crucial for timely problem detection and performance optimization.
Whaleal Platform provides powerful and comprehensive multi-dimensional monitoring for MongoDB, covering various operational states from host-level performance metrics to MongoDB internal parameters, for both single nodes and clusters. This article will detail the core functionalities and advantages of Whaleal Platform’s MongoDB monitoring.
1. Overview of Multi-Dimensional Monitoring
The monitoring system of Whaleal Platform aims to provide users with a comprehensive visualization of MongoDB database data, helping administrators to understand real-time database status, performance bottlenecks, and potential issues. The platform supports monitoring information from multiple dimensions, including:
- Host-Level Monitoring: System resource usage such as CPU, memory, and disk usage.
- MongoDB Internal Parameters: Metrics like connection counts, read/write operations, and cache usage.
- Multi-Node Comparison Monitoring for Database Clusters: Performance metric comparisons across multiple nodes.
- Real-Time Monitoring: Detailed real-time status of individual nodes.
2. Single Node Monitoring
Whaleal Platform offers in-depth monitoring for individual MongoDB nodes. Users can view more than 30 different monitoring metrics for each node, which helps in understanding the database’s operational status from multiple perspectives.
2.1 Host-Level Monitoring
For each host running a MongoDB node, Whaleal provides comprehensive system resource monitoring, including:
- CPU Usage: Monitors CPU usage to help determine if performance issues are due to insufficient computational resources.
- Memory Usage: Displays memory allocation and usage, allowing users to assess if memory is a system bottleneck.
- Disk I/O: Tracks disk read/write speeds and latency to ensure the health of the storage system.
- Network Traffic: Monitors network connection counts and bandwidth usage to identify potential network bottlenecks.
2.2 MongoDB Internal Parameters Monitoring
Whaleal Platform also monitors key internal parameters of MongoDB to help users understand the database’s working state:
- Connection Counts: Views the number of active connections to avoid performance degradation due to excessive connections.
- Read/Write Operations: Monitors read and write operations per second to analyze database load.
- Cache Usage: MongoDB’s cache (WiredTiger) is crucial for performance; Whaleal provides detailed monitoring of cache usage to ensure optimal performance.
Users can customize time ranges and collection frequencies according to business needs, allowing for flexible monitoring of historical and real-time database status. For example, users can set a longer time range to observe overall trends or use a higher collection frequency to monitor sudden performance issues.
3. Cluster Multi-Node Comparison Monitoring
For MongoDB running in a cluster mode, Whaleal Platform offers multi-node comparison monitoring. This feature allows users to observe the status of multiple nodes simultaneously and identify performance differences between them. Comparison monitoring helps users address key questions such as:
- Is there a node in the cluster with abnormal performance, leading to reduced cluster performance?
- Are there nodes with higher resource usage or load compared to others?
- Which nodes have more pronounced performance bottlenecks?
This multi-node comparison monitoring is especially useful for analyzing replica sets, sharded clusters, and other distributed architectures, helping users optimize resource allocation and identify problematic nodes.
4. Real-Time Monitoring and Fine-Grained Analysis
Whaleal Platform also supports real-time monitoring of MongoDB nodes, allowing users to view detailed data at any given time. Key features of real-time monitoring include:
- Strong Real-Time Capabilities: Users can view the current status of nodes at any time, quickly detecting performance fluctuations and anomalies.
- High-Frequency Collection: Supports fine-grained data collection, providing detailed information during critical moments.
Real-time monitoring allows users to rapidly identify factors affecting database performance and respond swiftly to prevent issues from escalating.
5. Slow Queries and Hot/Cold Data Monitoring

Whaleal Platform provides specialized tools for monitoring and analyzing slow queries and hot/cold data in MongoDB. Users can easily view:
- Slow Queries: The system automatically captures and analyzes slow queries impacting performance, helping users optimize query structures and indexing strategies.
- Hot/Cold Collection Monitoring: Data collections in MongoDB are categorized as “hot” or “cold” based on access frequency. Whaleal allows users to view which collections are high-frequency “hot” data and which are low-frequency “cold” data. This monitoring helps users optimize data distribution and storage.
The monitoring of slow queries and hot/cold data provides users with more insights for optimizing database performance, helping manage MongoDB clusters effectively in high data volume and concurrency scenarios.
6. Customizable Monitoring Configuration
Whaleal Platform supports users in customizing monitoring ranges and frequencies according to business needs. Whether it is fine-grained monitoring of individual parameters or global performance tracking for clusters, users can adjust the settings flexibly.