Whaleal Platform Multi-Dimensional Monitoring for MongoDB
Whaleal Platform provides detailed, real-time MongoDB monitoring and customizable insights to optimize database performance.

In database management and maintenance, monitoring is crucial for ensuring database performance, stability, and health. MongoDB, as a high-performance, distributed NoSQL database, presents significant operational complexity, especially in clustered and large-scale deployments. Therefore, comprehensive and detailed monitoring is essential for timely issue detection and performance optimization.
Whaleal Platform provides powerful, comprehensive multi-dimensional monitoring for MongoDB, covering everything from host-level performance metrics to internal MongoDB parameters. This includes monitoring for both single nodes and clusters. This document details the core features and benefits of Whaleal Platform’s MongoDB monitoring.
Overview of Multi-Dimensional Monitoring
Whaleal Platform’s monitoring system is designed to provide users with a complete visual representation of MongoDB database data, helping administrators understand database operation status, performance bottlenecks, and potential issues in real time. The platform supports monitoring various dimensions, including:
- Host-Level Monitoring: CPU, memory, and disk usage
- MongoDB Internal Parameters: Connection counts, read/write operations, and cache usage
- Cluster Multi-Node Comparison Monitoring: Performance metrics comparison across multiple nodes
- Real-Time Monitoring: Detailed status of individual nodes
Single Node Monitoring
Whaleal Platform offers in-depth monitoring for individual MongoDB nodes. Users can view over 30 different types of monitoring data for each node, which helps them understand database operation from multiple perspectives.
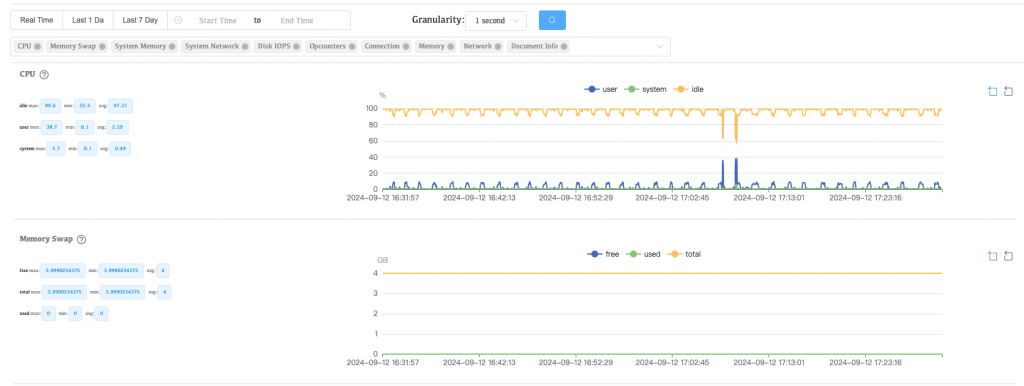
2.1 Host-Level Monitoring
For each MongoDB node’s host, Whaleal provides comprehensive system resource monitoring, including:
- CPU Usage: Monitors CPU usage to determine if performance issues are due to insufficient computational resources.
- Memory Usage: Displays memory allocation and usage to assess if memory is a system bottleneck.
- Disk I/O: Tracks disk read/write speeds and latency to ensure storage system health.
- Network Traffic: Monitors network connection counts and bandwidth usage to identify potential network bottlenecks.
2.2 MongoDB Internal Parameter Monitoring
Whaleal Platform also monitors core internal parameters of MongoDB, helping users understand database operations:
- Connection Counts: Views the number of active connections to avoid performance issues from excessive connections.
- Read/Write Operations: Monitors per-second read and write operations to analyze database load.
- Cache Usage: Provides detailed monitoring of MongoDB’s WiredTiger cache usage to ensure optimal performance.
Users can customize monitoring time ranges and collection frequencies based on their needs, allowing them to view both historical and real-time database states.
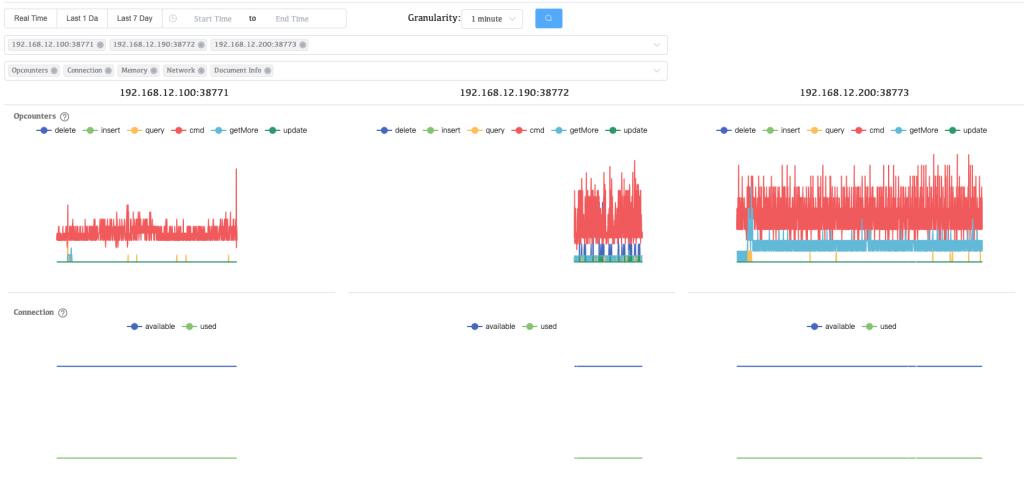
Cluster Multi-Node Comparison Monitoring
For MongoDB running in a clustered mode, Whaleal Platform offers multi-node comparison monitoring. This allows users to observe the status of multiple nodes simultaneously and identify performance differences between them. This feature helps answer key questions such as:
- Are there nodes with abnormal performance affecting the cluster?
- Are there nodes with higher resource usage or load compared to others?
- Which nodes have the most significant performance bottlenecks?
This multi-node comparison is particularly useful for analyzing replica sets and sharded clusters, aiding in resource optimization and problem node identification.
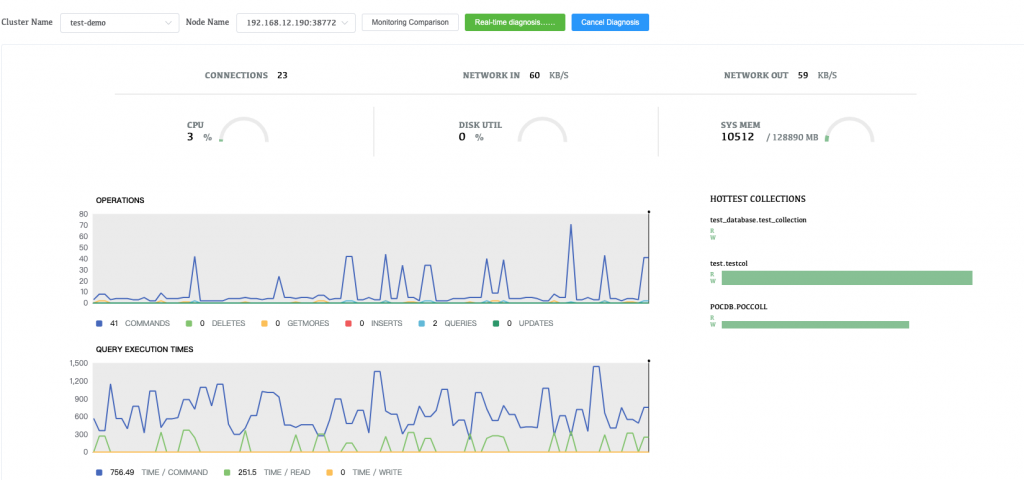
Real-Time Monitoring and Fine-Grained Analysis
Whaleal Platform supports real-time monitoring of MongoDB nodes, enabling users to view granular data at any given time. Real-time monitoring features include:
- Strong Real-Time Capability: Users can check the current node status at any time to quickly detect performance fluctuations and anomalies.
- High-Frequency Data Collection: Supports fine-grained data collection for detailed information during critical moments.
Real-time monitoring allows users to quickly identify performance-impacting factors and respond promptly to prevent issue escalation.
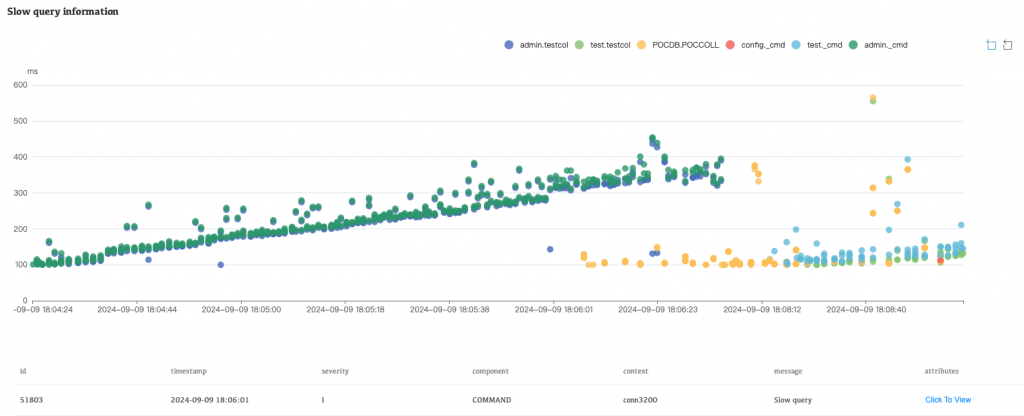
Slow Query and Hot/Cold Data Monitoring
Whaleal Platform provides specialized monitoring and analysis tools for MongoDB’s slow queries and hot/cold data:
- Slow Query Analysis: Automatically captures and analyzes slow queries affecting performance, helping users optimize query structures and indexing strategies.
- Hot/Cold Data Monitoring: Monitors data collections categorized as “hot” (frequently accessed) and “cold” (infrequently accessed), helping users optimize data distribution and storage.
These monitoring capabilities provide users with more insights for optimizing database performance, especially in high-data-volume and high-concurrency scenarios.
Custom Monitoring Configuration
Whaleal Platform allows users to customize monitoring scopes and frequencies based on business needs. Whether for fine-grained monitoring of specific parameters or global performance tracking across the cluster, users can flexibly set up monitoring tasks to obtain essential information at the right times.
Summary
Whaleal Platform’s multi-dimensional monitoring provides MongoDB users with detailed real-time insights into host-level performance, MongoDB internal parameters, and cluster-wide performance comparisons. The platform enables administrators to monitor, analyze, and optimize MongoDB operations effectively. From tracking slow queries to identifying resource bottlenecks, Whaleal Platform ensures that organizations can maintain a high-performing, stable MongoDB environment.