Blog

Deep dives on MongoDB internals and how Whaleal Platform solves real operational problems — clustering, indexing, replication, backup, and monitoring.

MongoDB 9.0 at a Glance: Performance, Security, Observability and What to Know Before Upgrading

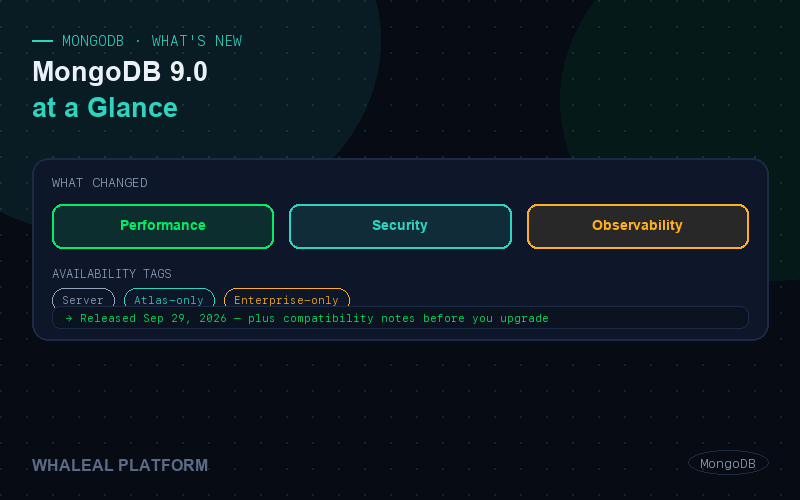
MongoDB 9.0 was released on September 29, 2026, covering Atlas, Enterprise Advanced, Community Edition and self-managed environments. This post goes through its main changes by theme, and tags each one as a server capability available everywhere, Atlas-only, or Enterprise Advanced-only. A final section collects the compatibility changes and known issues listed in the release notes, to help you decide when to upgrade.

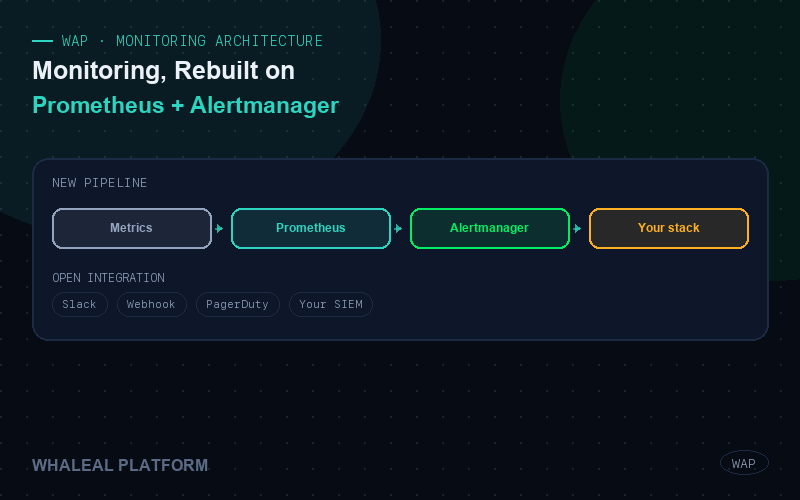
WAP Monitoring on a New Foundation: Prometheus, Alertmanager and Open Integration Interfaces

The monitoring logic in Whaleal Platform has been rebuilt on a new foundation: collecting, storing and evaluating metrics is handled by Prometheus, while deduplicating, grouping, inhibiting, silencing and routing alerts is handled by Alertmanager. WAP also exposes interfaces so you can plug its metrics and alerts into the monitoring platform you already run, instead of standing up another silo. This post explains how the new pipeline works and the ways you can connect to it.

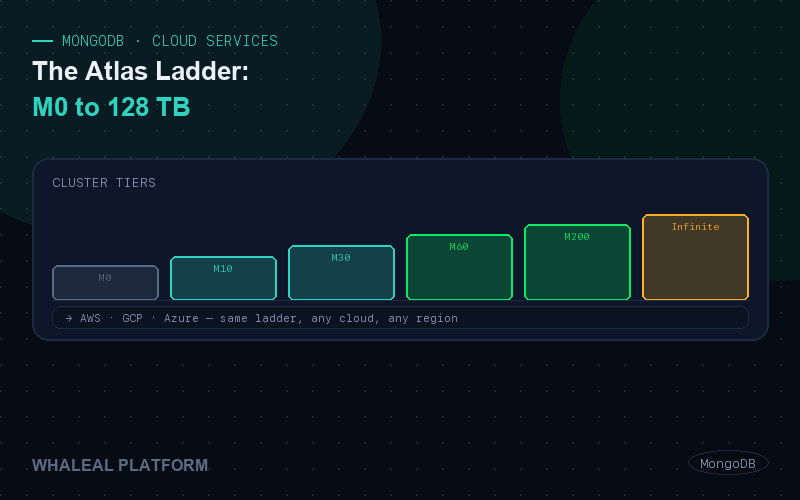
MongoDB in the Cloud: The Atlas Ladder from M0 to 128 TB

Say "MongoDB in the cloud" and most people mean Atlas. It runs on all three major public clouds, from a free starter cluster up through large dedicated tiers, and now there's Infinite, a version that just entered public preview. This post goes through it in order — clouds and regions, tiers, elasticity, backup and security, the new edition — and finishes with how to choose between a managed service and running it yourself.

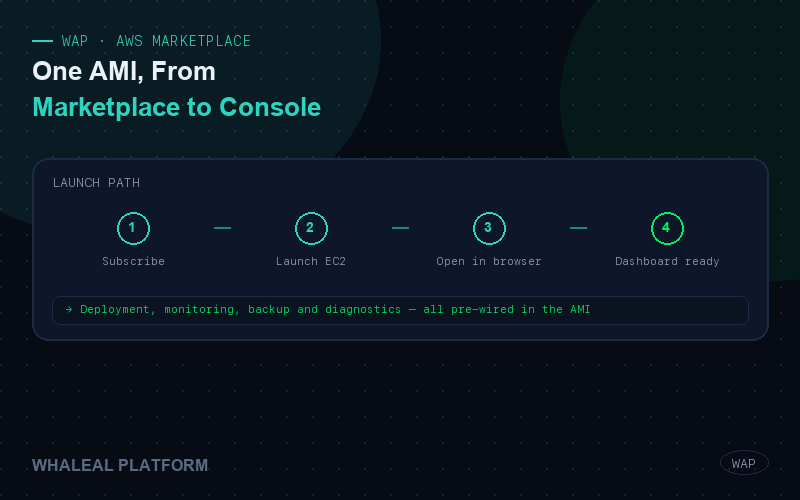
Launching WAP on AWS: From Marketplace to Console with One AMI

Whaleal Platform is now listed on AWS Marketplace and delivered as an AMI. Subscribe, launch an EC2 instance, open its address in a browser, and you have MongoDB deployment, monitoring, backup and diagnostics at your fingertips. This post walks the whole path: how to launch, which instance to pick, what you get once it's up, and how billing and support work.

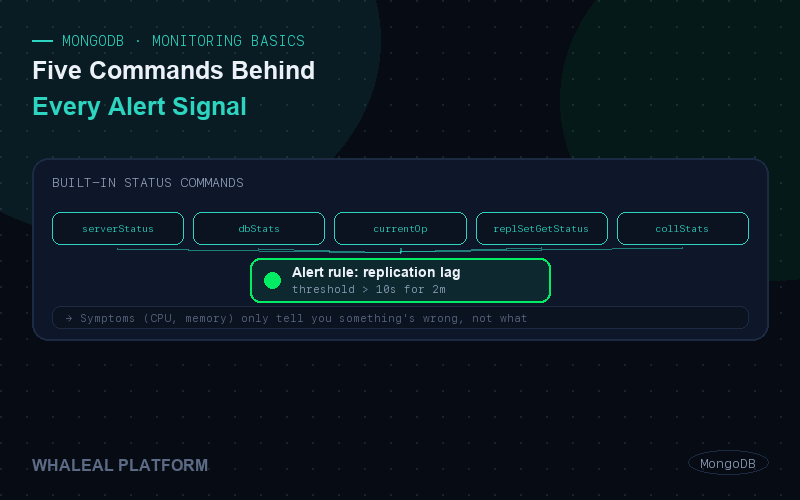
Where Alert Signals Come From — Five MongoDB Built-in Commands Worth Watching

High CPU and rising memory are only symptoms. What actually tells you what's going on inside the database is a handful of status commands MongoDB ships with. This post picks the five best suited to drive alerts, and explains what each one shows and what rule it can become.

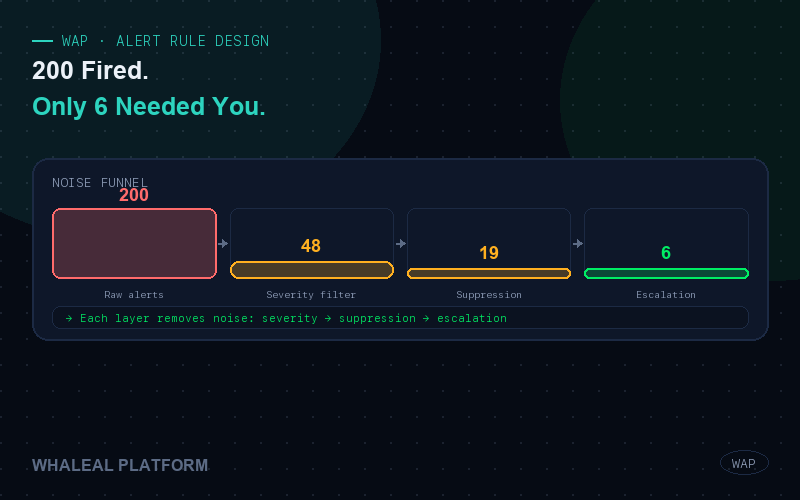
200 Alerts Fired, Only 6 Needed You — Designing Alert Rules in WAP

The biggest enemy of an alerting system isn't a missed alert — it's noise. When hundreds of notifications a day train a team to stop reading them, the one that matters gets buried. This post breaks down how to design alert rules in the Whaleal Platform alerting module: from what a single rule should contain, to severity, suppression and escalation, filtering out noise one layer at a time.

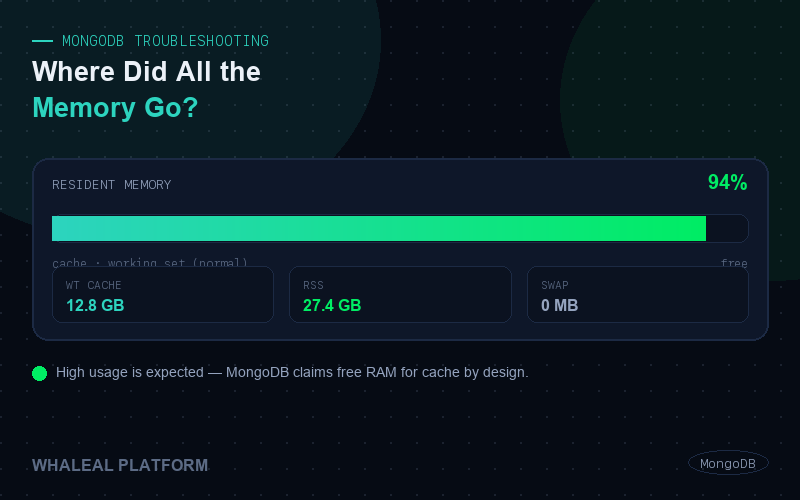
MongoDB Memory Usage Too High? Where to Start Looking

Seeing 90% memory usage and starting to panic? Hold on — MongoDB is designed to use up every bit of memory it can get its hands on. This post is about telling "normal" apart from "actually a problem," and exactly where to start looking once memory really is running out.

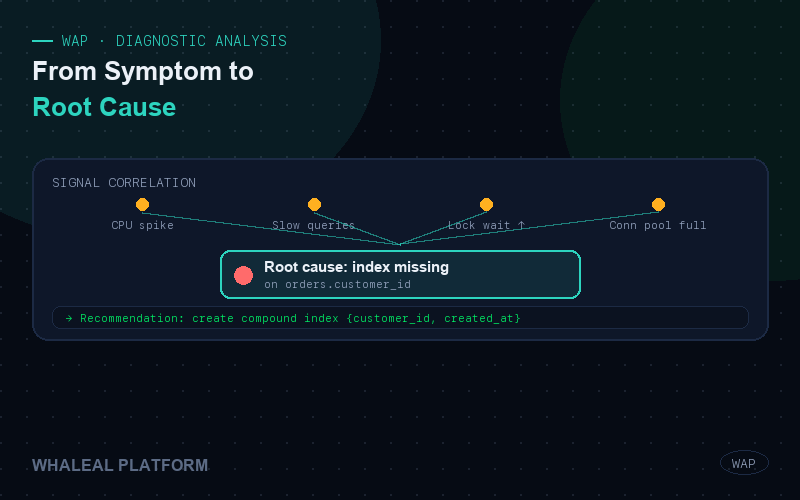
Not Just Finding the Problem — Explaining Why. Inside WAP's Diagnostic Analysis

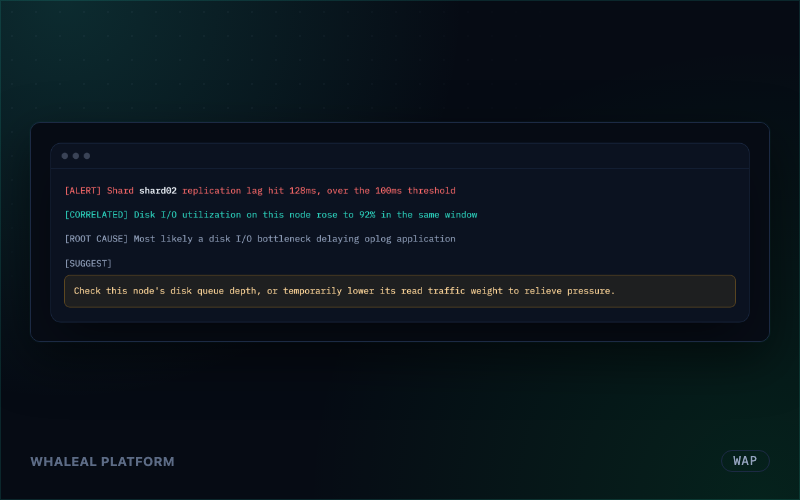
A competent monitoring system tells you "CPU is high." A competent diagnostic system also tells you why it's high and what to do about it. This post breaks down the logic behind WAP's diagnostic analysis — from cross-referencing multiple signals, to ranking root causes, to handing you a recommendation you can act on immediately.

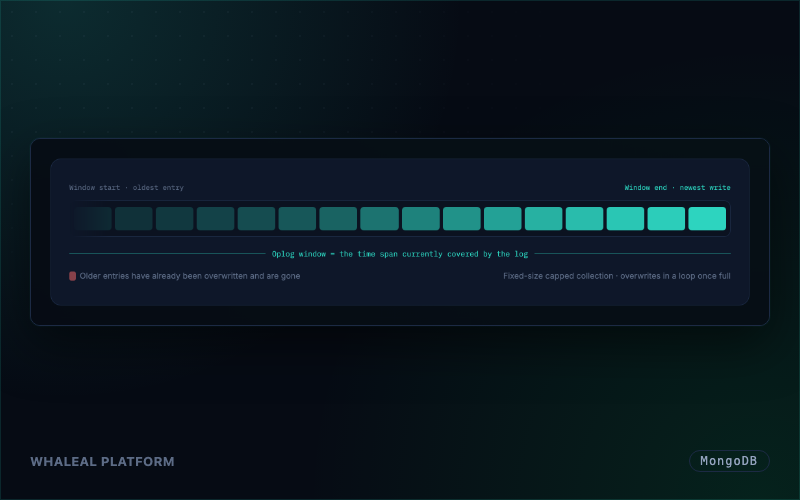
MongoDB Oplog: One Log, Holding Up Both Replication and Backup

How does a replica set stay consistent, and how does a backup restore to any exact point in time? Both answers point to the oplog — the often-overlooked log that holds up the entire high-availability story.

What You See the Moment You Open It — WAP's Real-Time Monitoring Page

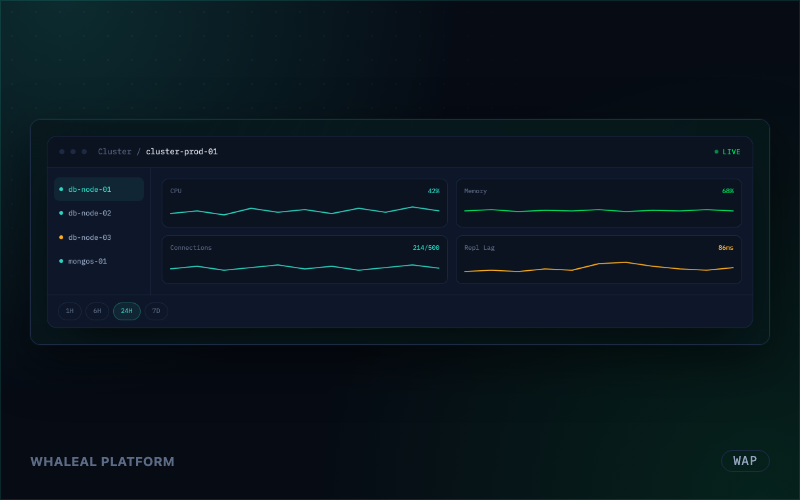
A good monitoring page should tell you what's wrong within ten seconds and why within a minute. This post breaks down what WAP's real-time monitoring page does — overview, drill-down, comparison, and history.

MongoDB Time Series Collections: Your Metrics Don't Belong in a Regular Collection

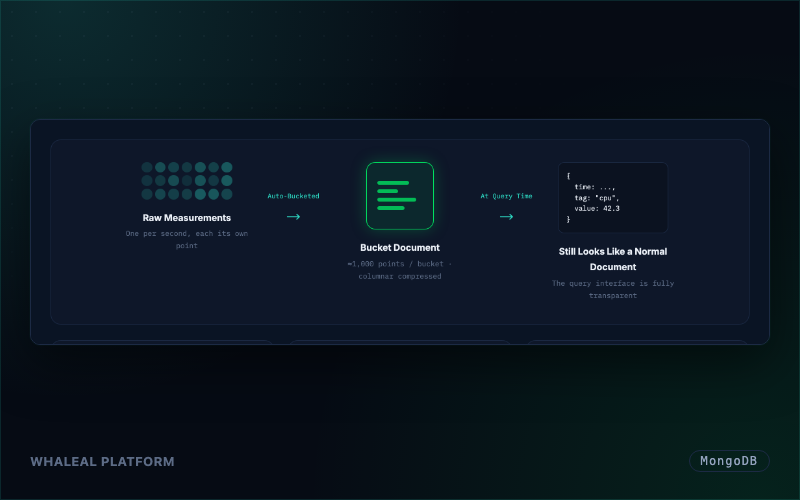
If you're still storing metrics, sensor readings, or market ticks one document per data point in a regular collection, you're paying for storage and query costs you don't need to. Here's how Time Series Collections fix that.

Behind the Health Score — Every Metric WAP Tracks

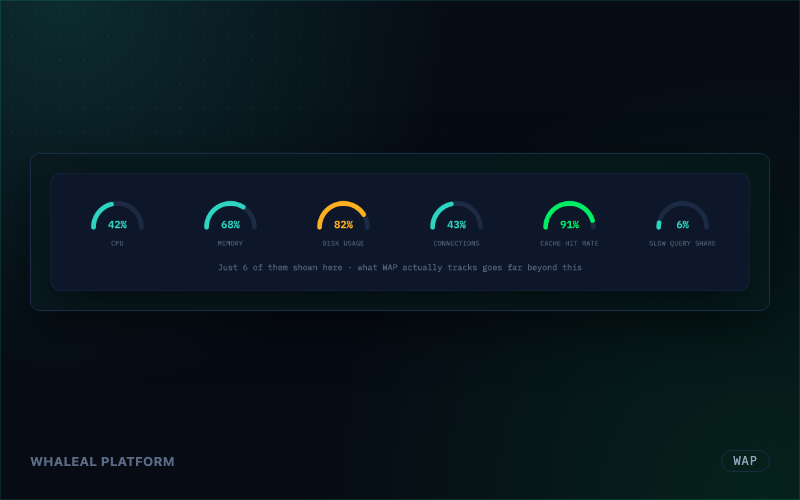
"Health Score: 98" is the output of dozens of metrics, continuously collected and weighted. This post lays out exactly what WAP tracks — from the host, to the instance, to the replication chain, to the query layer.

Hear It Before It Happens — Inside WAP's Monitoring & Alerting Module

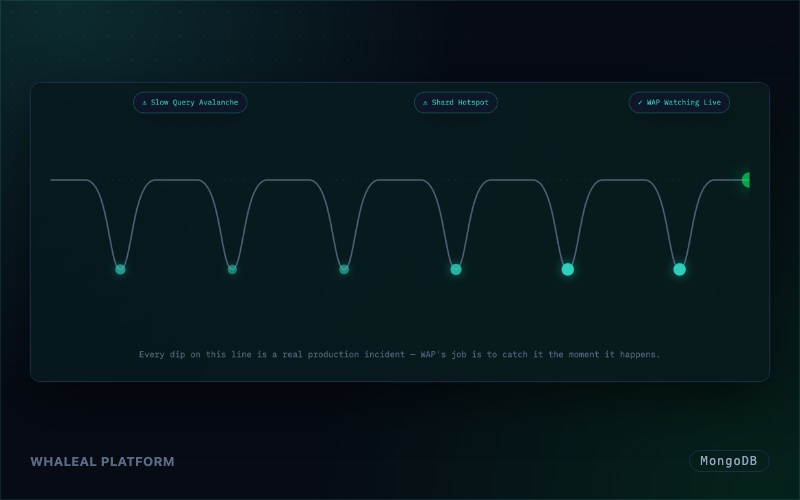
Every metric on your cluster is a vital sign. Whaleal Platform tracks them continuously, and the moment one crosses the safe line, the alert reaches the right person immediately.

MongoDB Indexes Are Trickier Than They Look

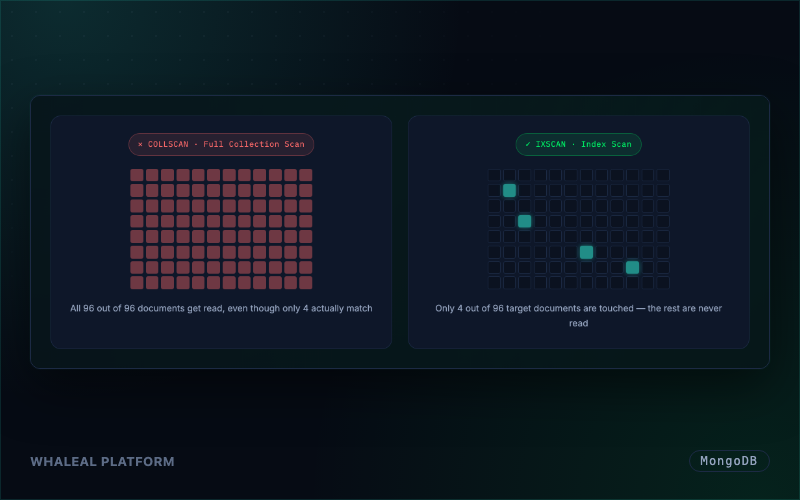
"Just add an index" sounds simple. But how you build it, how you order the fields, and whether it satisfies a covered query decide whether your query runs in milliseconds or just gets lucky.

Reading Your Database Like a Sediment Core — Inside WAP's Backup & Recovery Module

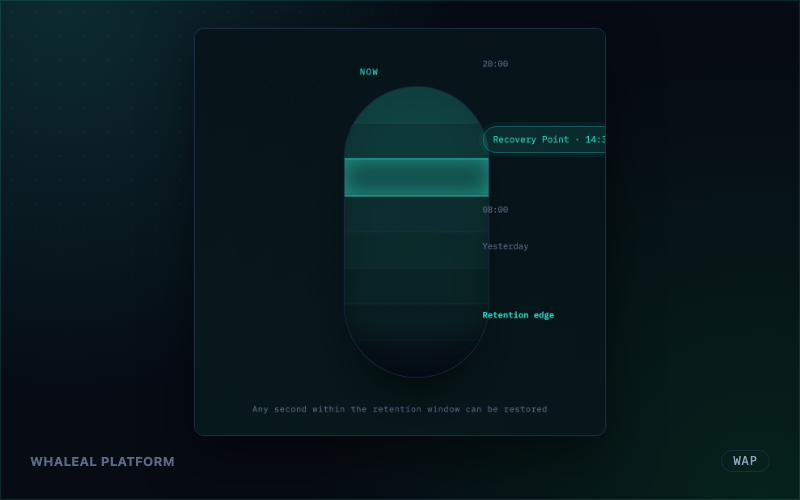
Whaleal Platform's backup module turns your database into a continuous, recorded timeline — whether it's a replica set or a sharded cluster, any single time slice can be pulled out with precision.

Breaking Down MongoDB Clusters: From a Single Node to Replica Sets to Sharding

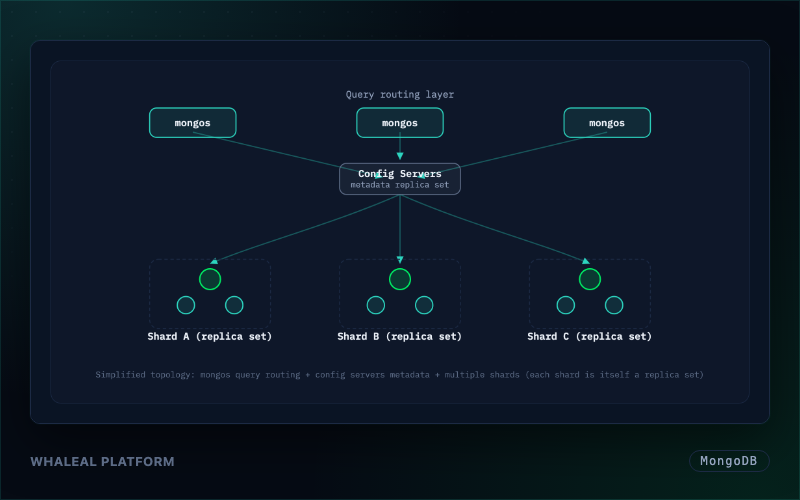
This post walks through MongoDB's two clustering topologies — replica sets and sharded clusters — what problem each one solves, and how to choose between them.

Running MongoDB in Production? You'll Hit These Traps Eventually — Featuring Whaleal Platform

From missing indexes to lopsided shards, from election storms to backups that quietly stopped working — six traps we've seen play out across MongoDB clusters, and how Whaleal Platform turns each into a routine, manageable event.

Diving Into the Data Deep — How Whaleal Platform Reinvents MongoDB Operations

Whaleal Platform (WAP) is our in-house automation and monitoring platform for MongoDB — visual monitoring, intelligent diagnostics, one-click operations, and point-in-time recovery, backed by enterprise-grade SLAs.